Mobility in Germany and Social Distancing
Social distancing is on everyone’s mind, and when you go outside in Germany the streets surely feel emptier. But are people actually staying at home more than usual?
Using digital data sources, we can measure how people move and if they have changed their behavior in recent weeks. To this end, we use anonymized mobility datasets gathered from mobile phones.
In our datasets, we see how many people move within and between counties (Landkreise) in Germany. We know how many people move, but we do not know who. We can’t distinguish individuals or gain access to any personal information such as age or gender. For more details on the data and what constitutes a trip, see the data and methods page.
General mobility trends
So, are people moving less than usual? The short answer: Yes
During March 2020, we see a distinct decrease in overall mobility. On a typical weekday, we would see around 190 million trips in the beginning of March. At the end of the month, this has decreased to around 120 million trips.
When we compare the number of movements to an average week from March 2019, we clearly see a deviation from the “normal” baseline. Mobility starts to decrease noticeably in the second week of March, with most change taking place in the third week, from March 15-22.
The strong decrease in the third week of March coincides with many major policies taking effect, restricting the movement in Germany. Notable events:
- March 12th: Chancellor Merkel urges Germans to avoid social contact whenever possible and calls for the cancellation of events with over 1000 people
- March 14th (and surrounding days): Increased measures to limit public activities are put in place in several states, such as closures of schools and child day cares
- March 18th: Chancellor Merkel announces world-wide non-essential travel ban, border closures take effect
- March 20th: The state of Bavaria becomes the first to announce a curfew
These policies, paired with social distancing measures by individuals and companies, lead to the strong decrease of mobility in the third week of March.
Although the effect of individual policies is hard to distinguish, some can be seen more clearly. The curfew in Bavaria announced on March 20th lead to the strong decrease in mobility in the following days. You can see this regional effect easily in the Mobility Monitor dashboard.
The most recent data shows a slight rise in mobility in the beginning of April. We will have to observe whether or not this trend continues.
Maps of mobility changes
The decrease in mobility does not affect all regions of Germany the same. Some areas experience more cases of Covid-19, policies are implemented in different ways on a federal state level, and so the degree of social distancing differs.
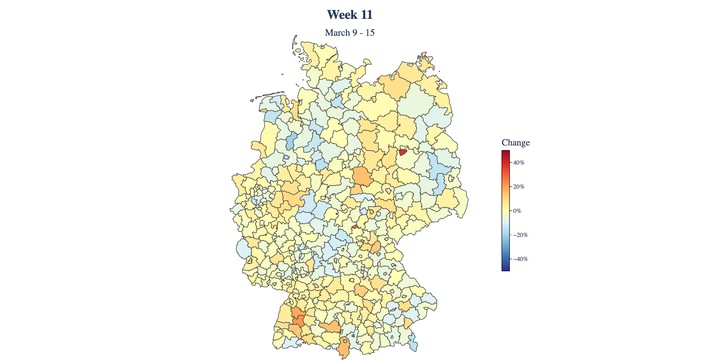
The following maps show the change in mobility for select weeks, where we compare weeks from March 2020 to an averaged week from March 2019.
For each district, we show the change in trips originating in this district. This data is the same as shown on the Mobility Monitor, but here it is averaged over a week.
In calendar week 11, we observe little change on a regional level. The general mobility starts to decrease, but the deviation from the normal baseline is only -2.2% and not yet noticeable on the map.
Week 12 is when most restrictions began to take effect. Mobility drops noticeably to -25.8% below normal.
There is also a clear difference between the western and eastern states of Germany. In the western states, which are more affected by Covid-19, mobility reductions are greater.
In Week 13, the mobility decrease is at -39.0% below the baseline and starts to level out.
In this week, we can distinctly see distinct regional differences:
- Border regions are more affected
- Cities and metropolitan areas show a larger decrease in mobility than rural areas
- The state of Bavaria displays low overall mobility levels
You can explore these regional effects on your own in the Mobility monitor.
Comparison of major cities
As seen on the maps, the decrease in mobility is stronger in cities than in rural areas: In almost all of the 20 largest cities in Germany, the reduction in mobility is noticeably above the national average.
Travel over long distances
Lastly, we look at what type of movements is most affected. The first target of social distancing measures were unnecessary long-distance trips such as vacations, work trips, and visits to family and friends.
To test if long-distance travel is more strongly affected, we look for differences in trips within and between districts.
We find that trips between districts have decreased noticeably stronger than those within districts, up to -70% below normal.
Summary
Our first analysis shows that mobility in Germany changed substantially in mid-March 2020. Overall, we observe a steady plateau of around -40% less trips than normal.
In our next reports, we will examine different aspects of mobility changes such as:
- How are different regions affected? Is there a correlation with local case numbers of Covid-19?
- How are different types of trips affected, for example over long distances?
- Are there structural differences in the German mobility network compared to normal?
In addition to focused reports on certain topics, we will continue to monitor how overall mobility changes in Germany in the coming weeks and publish reports on this page.
Frank Schlosser
Scientific Project Lead
Frank is researching human mobility and its relation to epidemic spreading